Debugging Your Plugin
Code Log
Plugins deployed under a BioT account can write to logs using standard logging outputs.
For example in JavaScript you would normally use:
console.log("Starting Plugin Execution");
And in Python:
print("Starting Plugin Execution")
BioT will save the output to the cloud logging system.
Accessing the Log
If things are not working as expected or even during development, you can always access the plugin logs through AWS's CloudWatch service.
Click on the Monitor tab, and on the Logs tab, then click on Log Groups and search for the plugin name

To view the latest logged data in CloudWatch, select the latest log stream.

The logged strings for your plugin are tracked here.
For more information about logging in AWS, see Viewing CloudWatch Logs.
Advanced Search
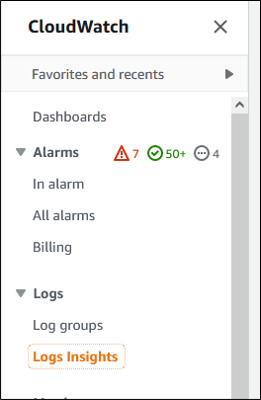
AWS offers Logs Insights which allows you to search multiple logs and log groups simultaneously, search for specific strings and filter the results according to time and log field name.

For more information and examples on how to use Logs Insights, see Analyzing Log Data.
Updated about 1 year ago
