Viewing Historical Measurements
The Observations tab of the Patient page in BioT contains live and historical readings from any devices that are assigned to the patient.
NoteIt is possible to configure whether the Observations tab opens to the Live view or the Historical view. This can be configured in the Portal Builder (for more information, see Customizing Organization Portal Layouts).
To view historical readings in the Observations tab:
- Login to the BioT Organization Portal.
- Select a patient to view.
- From the Patient page, click on the Observations tab.

- In the Observations tab, click on History in the top left hand corner.
- Select a view range from the dropdown menu. This can be a minimum of 5 minutes and a maximum of 5 years.
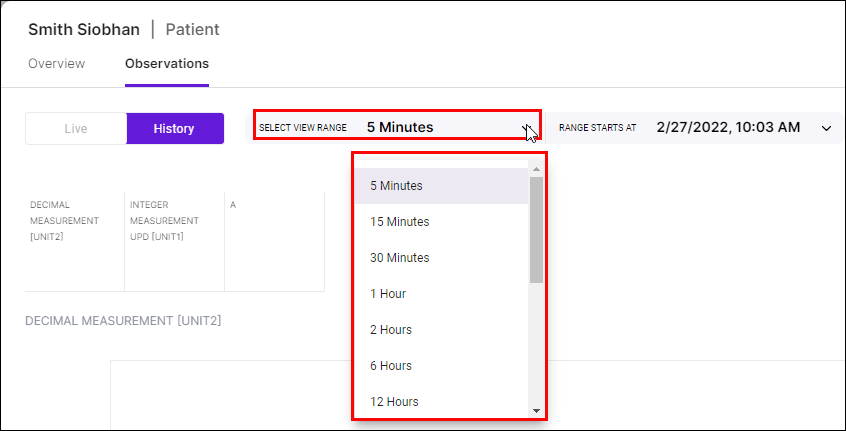
- Select what date and time the range should start from:
a. Click on the time and date dropdown.

b. Click on the calendar and clock icons to select the time and date from which the range should start.
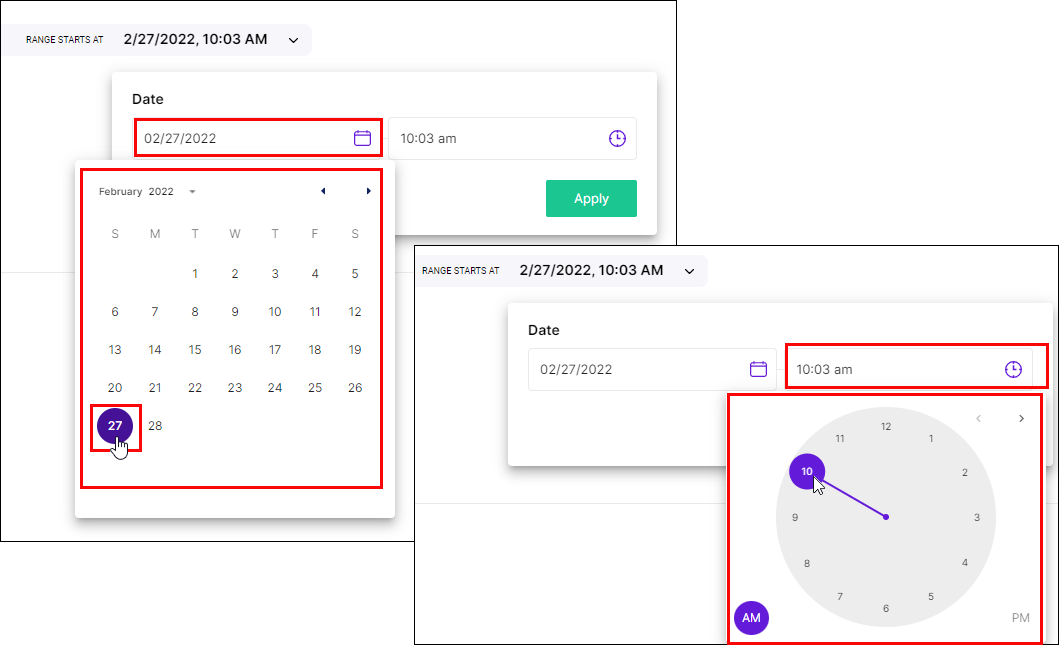
c. Click Apply.
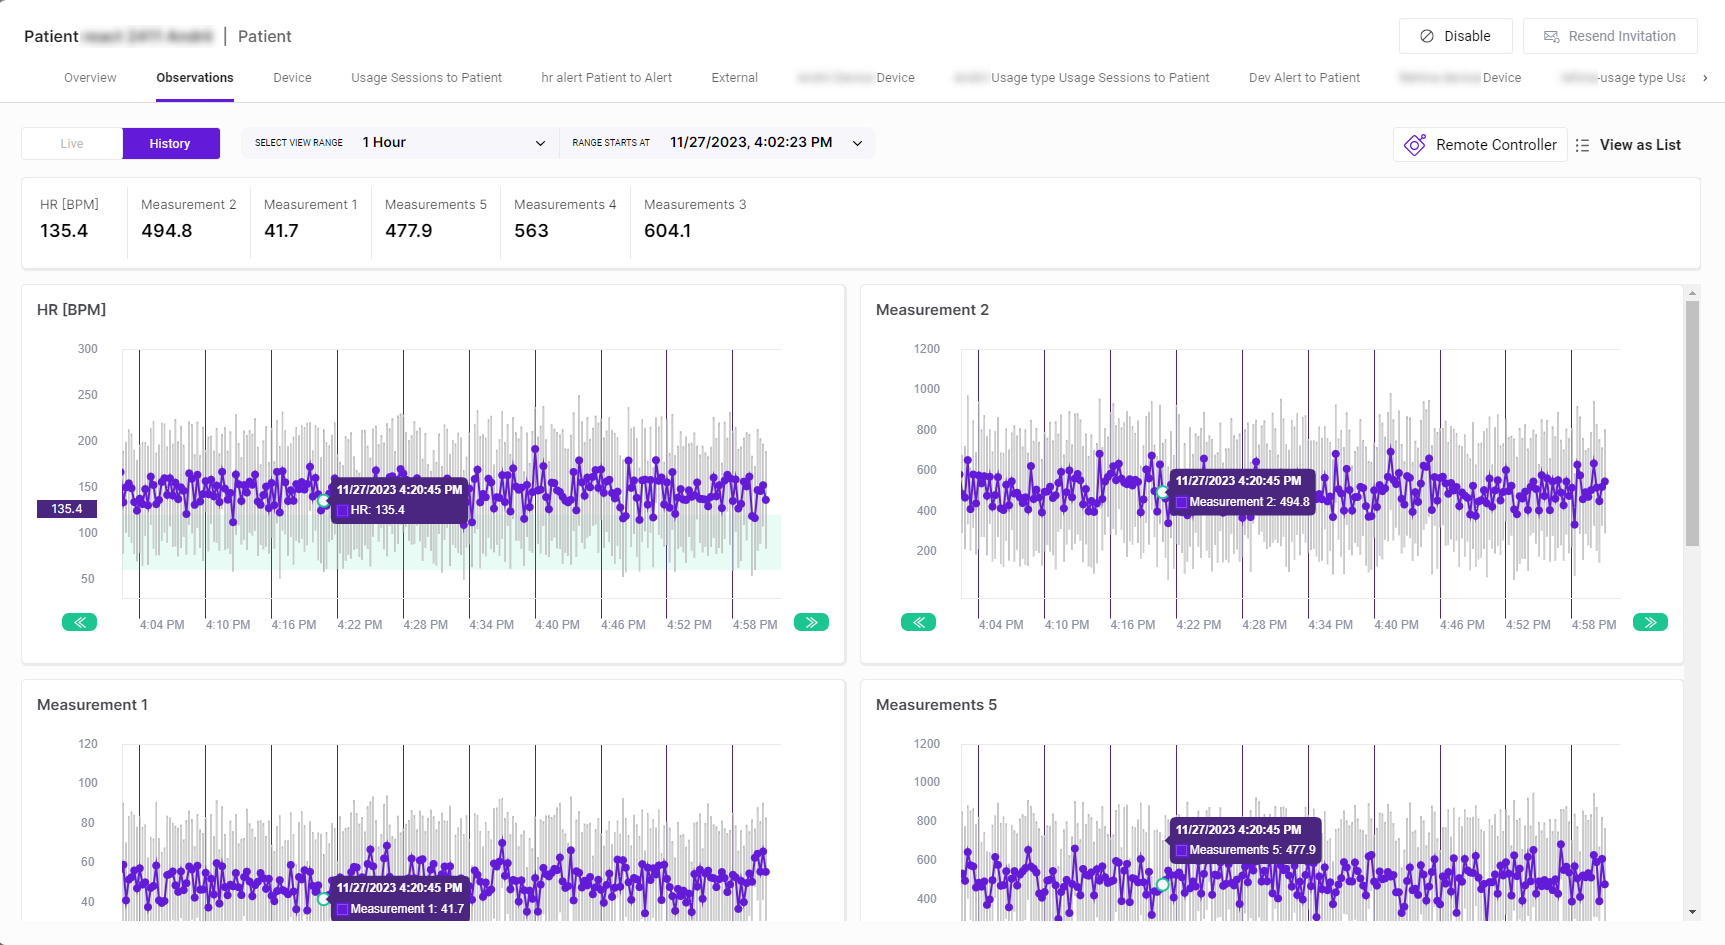
- If no data appears initially, use the green arrows under the first observation section to move forward or backward until the data appears.
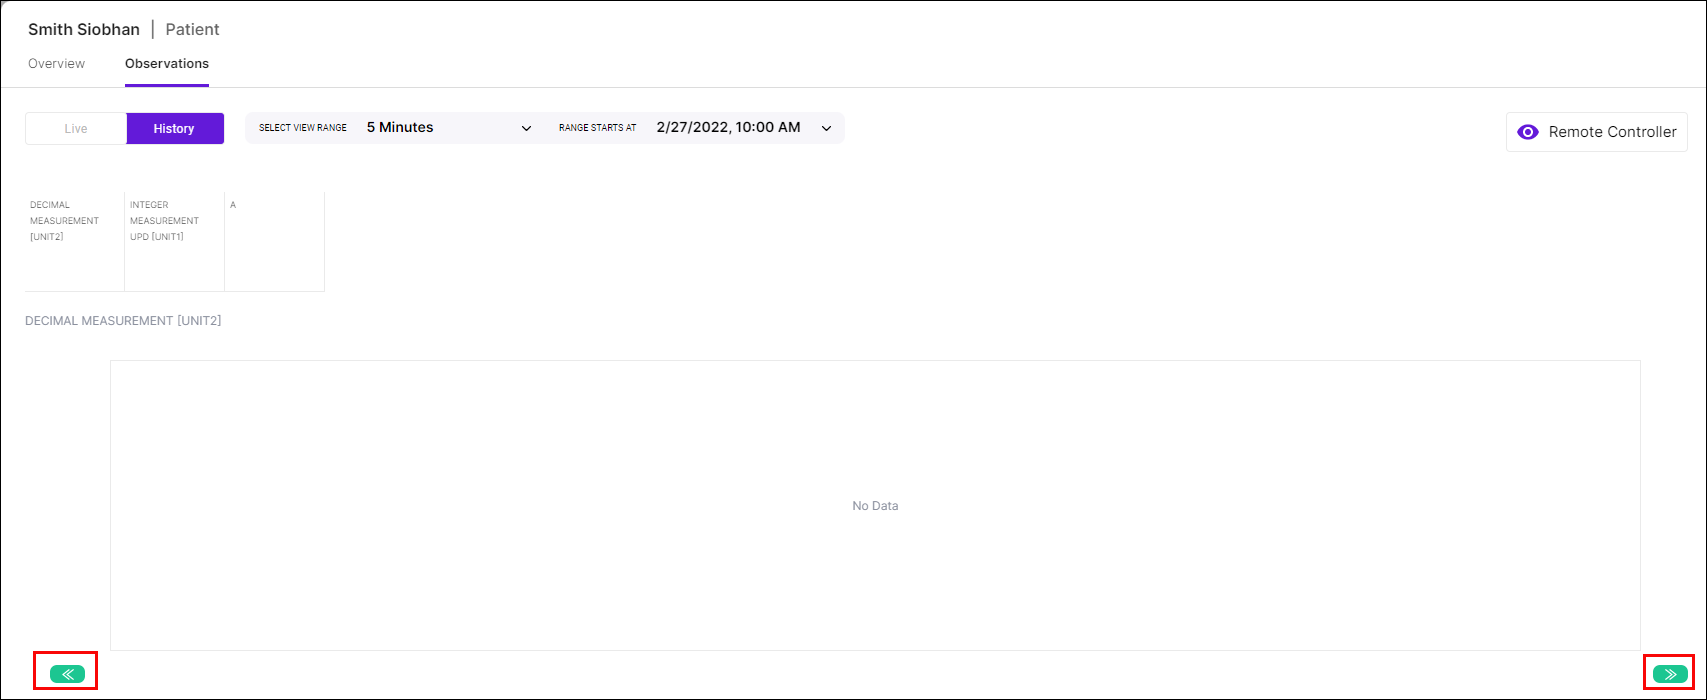
NoteThe headlines and charts displayed can be configured in the Portal Builder and are the same for both live and historical measurements.
You can use the arrows to move back and forth in the historical data and see specific times or events that occurred.
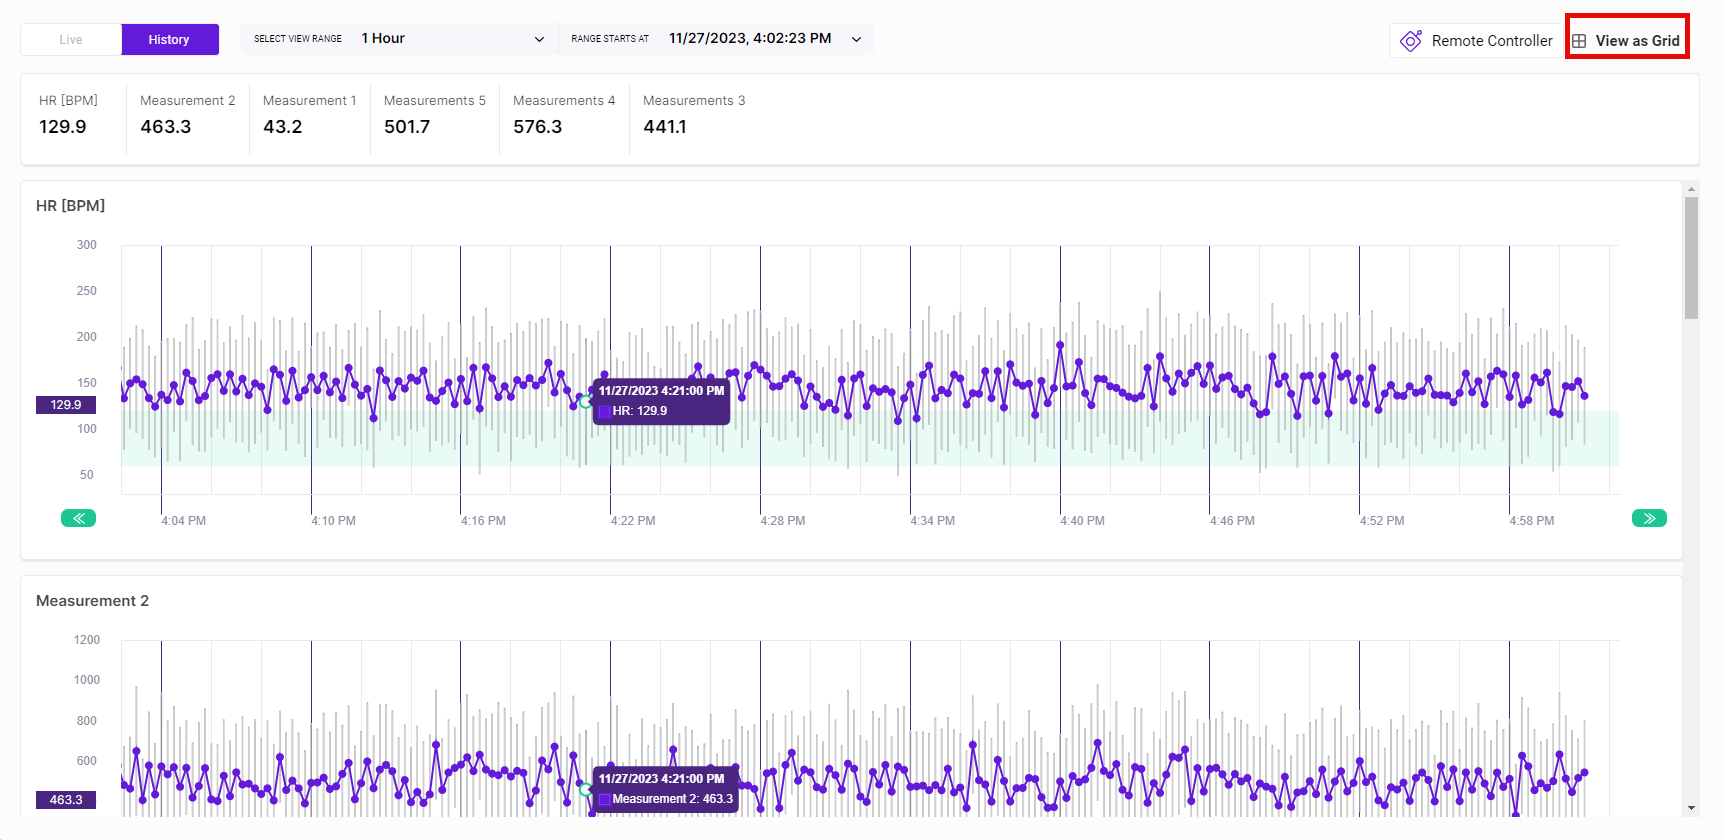
If you hover the mouse over a specific point, the measurements for that point in time appear in the Measurements Table on the top left of the screen.
The green shaded area through the middle of the measurements shows the normal level for the specific measurement shown.
Scrolling down shows additional measurements.
Additionally, clicking View as Grid in the top right-hand corner of the tab shows the measurements as a grid rather than a list. To return to the list view, click View as List.
InfoThe specific measurements shown in a patient's observations tab depend on the specific devices assigned to that patient.
Updated 3 months ago
