Embed Grafana Dashboards in Portals
Learn how to embed Grafana dashboards into BioT portals and external portals with proper authentication and user token setup.
You can embed Grafana dashboards or individual panels into both BioT portals (Organization or Manufacturer) and external portals. This guide walks through the required steps to successfully embed and personalize the content.
Step 1: Get the Grafana Link
You can embed either:
- An entire dashboard, or
- A single panel from a dashboard
To embed a dashboard:
- Click the "Share" button at the top of the dashboard.
- Select "Share internally".
- Make sure "Shorten link" is turned off.
- Click "Copy link".
Alternatively, you can copy the URL directly from the browser address bar.
To embed a panel:
- Hover over the panel you want to embed.
- Click the three-dot menu in the top-right corner of the panel.
- Select Share → Share link.
- Make sure "Shorten link" is turned off, then click "Copy link".
Step 2: Embed in BioT Portals
To embed a Grafana dashboard in the Organization Portal or Manufacturer Portal, follow these steps:
2.1 Add a Tab Using Portal Builder
- Log in to your Console Portal.
- Navigate to Portal Builder.
- From the list of pages, select the relevant page where you want to add the new tab.
- In the Tabs Section, click on "Add Tab".
- Select "External Page" as the tab type.
- Name the tab and paste the Grafana link from Step 1.
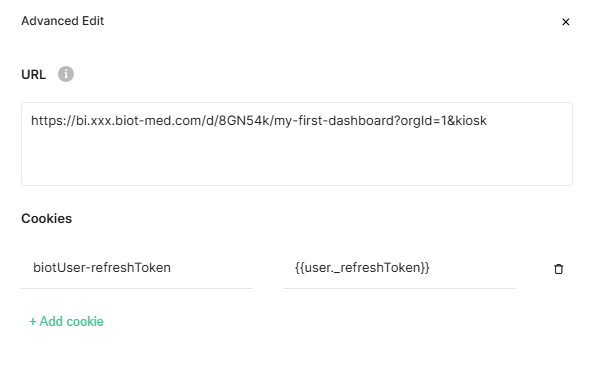
2.2 Add a Cookie to Link the User Token
After adding the tab, click the pencil icon (Advanced Edit) next to the URL field.
Add the following cookie:
- Name: biotUser-refreshToken
- Value:
{USER._REFRESHTOKEN}
Step 3: Embed in External Portals
For third-party portals, custom web apps, or mobile applications, follow these steps:
3.1 Set the User Token via Cookie
You must programmatically set the refresh token as a cookie before displaying the Grafana iframe.
document.cookie = `biotUser-refreshToken=${'$USERREFRESHTOKEN'}; path=/; domain=bi.app.${'${your-biot-domain.com}'}; secure`;- Replace userRefreshToken with the actual token value.
- Replace the value of the domain with your BioT deployment domain
3.2 Embed the Grafana Content
Use an <iframe> in your external site:
<iframe src="https://bi.app.${'${your-biot-domain.com}'}/d/bdv75g6oz8etcf/my-dashboard?orgId=1"
  width="100%"
  height="800"
  frameborder="0">
</iframe>
Make sure your portal domain matches your BioT deployment domain
Kiosk Mode: Recommended for Clean Embeds
To prevent unwanted UI elements from appearing (such as Grafana menus, headers, or sidebars), you can use kiosk mode by adding &kiosk to the end of the Grafana URL.
https://bi.app.$${your-biot-domain.com}/d/bdv75g6oz8etcf/my-dashboard?orgId=1&kiosk
Use Kiosk Mode for Cleaner EmbedsWhile kiosk mode cannot be enforced by us, you should configure the Grafana URL with &kiosk to ensure a clean, embedded view and avoid unexpected UI elements in both portal and mobile views.
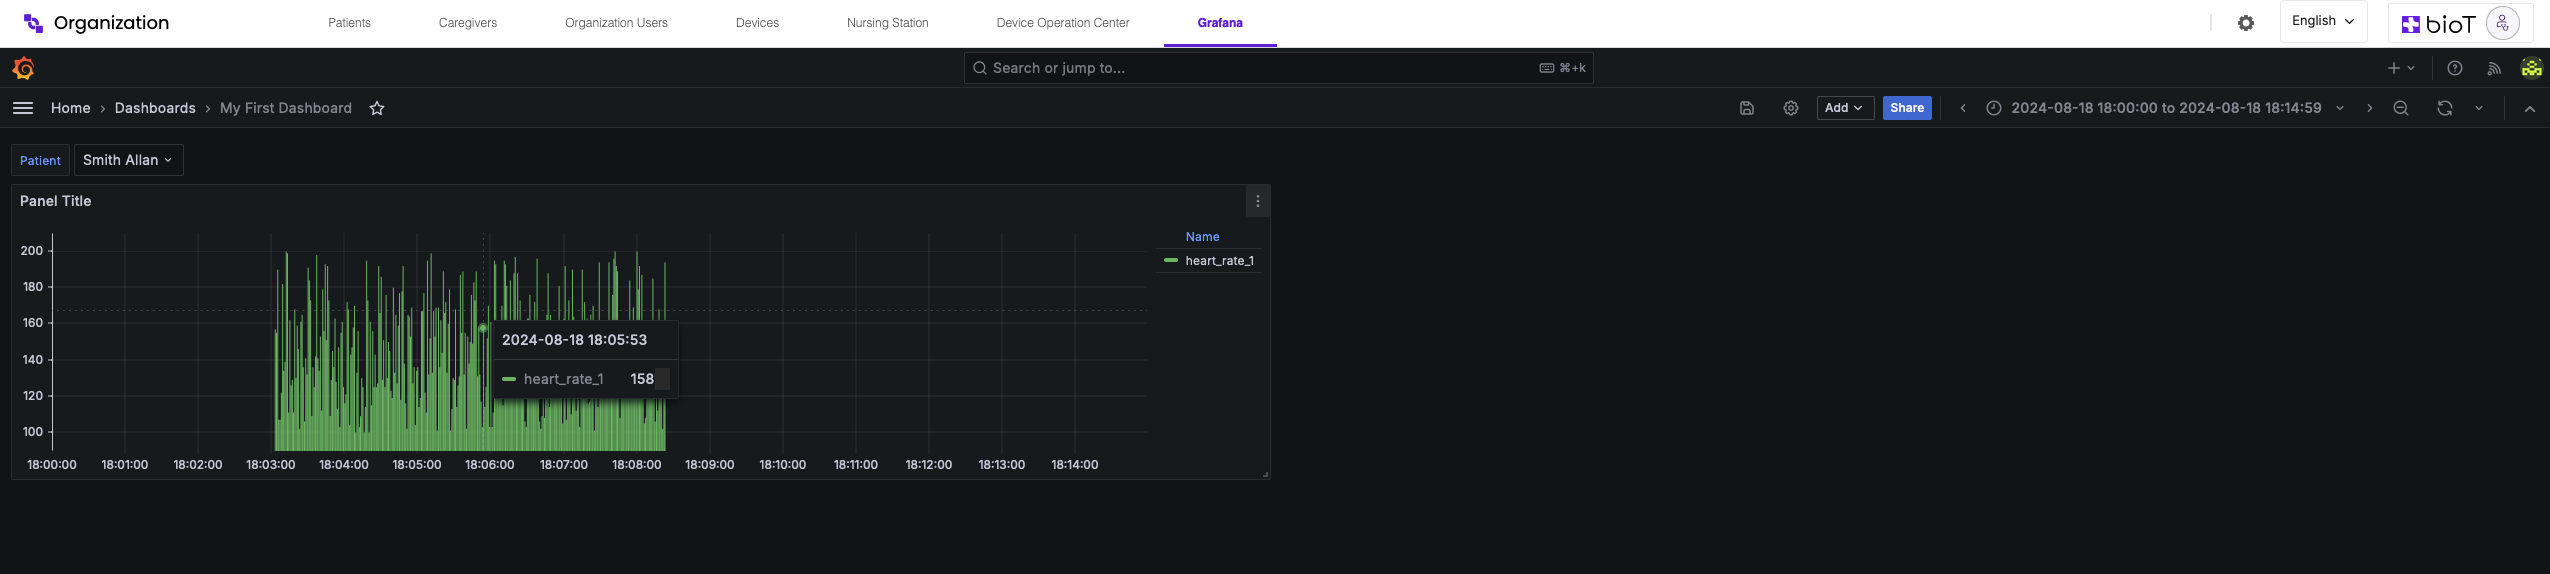
Step 4: Verify the Embedded Content
After embedding:
- Log in to the BioT or external portal.
- Open the embedded Grafana tab or iframe.
- Confirm that:
- The dashboard loads successfully.
- Data is filtered per the logged-in user.
- PHI is only visible to users with appropriate permissions.
Access Control Notes:
- Users without PHI access (e.g., Manufacturer Admins) will not see sensitive data, even if it exists in the dashboard.
- Patient users do not have permission to view analytics data
You can embed either:
An entire dashboard, or
A single panel from a dashboard
Updated about 1 month ago