
Grafana Integration
BioT provides seamless integration with Grafana, a powerful open-source platform for monitoring and observability. Grafana excels in visualizing time-series data, making it an ideal choice for tracking and analyzing medical records and results.
Version Support: Starting from BioT version 2.3.40, the integration includes Grafana version 12.2.1.
Grafana is available only when the BioT Analytics DB add-on is enabled for your environment. See Integration with the BioT Analytics DB.
With our integration, you can harness Grafana’s robust features to:
- Visualize Data: Create dynamic, interactive dashboards that display real-time heart rate, blood pressure, and other medical metrics.
- Monitor Trends: Leverage Grafana’s powerful querying capabilities to identify trends and anomalies in medical data over time.
- Customize Alerts: Set up custom alerts based on specific thresholds or conditions, ensuring timely notifications for critical health metrics.
- Enhance Reporting: Generate comprehensive reports and visualizations that support better decision-making and data-driven insights.
Our integration ensures that medical data is presented in an intuitive and accessible format, empowering healthcare professionals to make informed decisions and improve patient outcomes.
Getting Started
To access Grafana, log in to the BioT Console and open Dashboard Builder.
Grafana runs your queries using the BioT user you logged in with: a Developer User sees all data, including PHI, across all organizations. Other manufacturer users can open the same dashboards but do not see PHI. If your dashboards need PHI, ask your manufacturer administrator to create a Developer User - see Managing Users in BioT.
Once logged in, click the icon with four blocks in the top-right corner (see the image below for reference) and select “Dashboard Builder.”
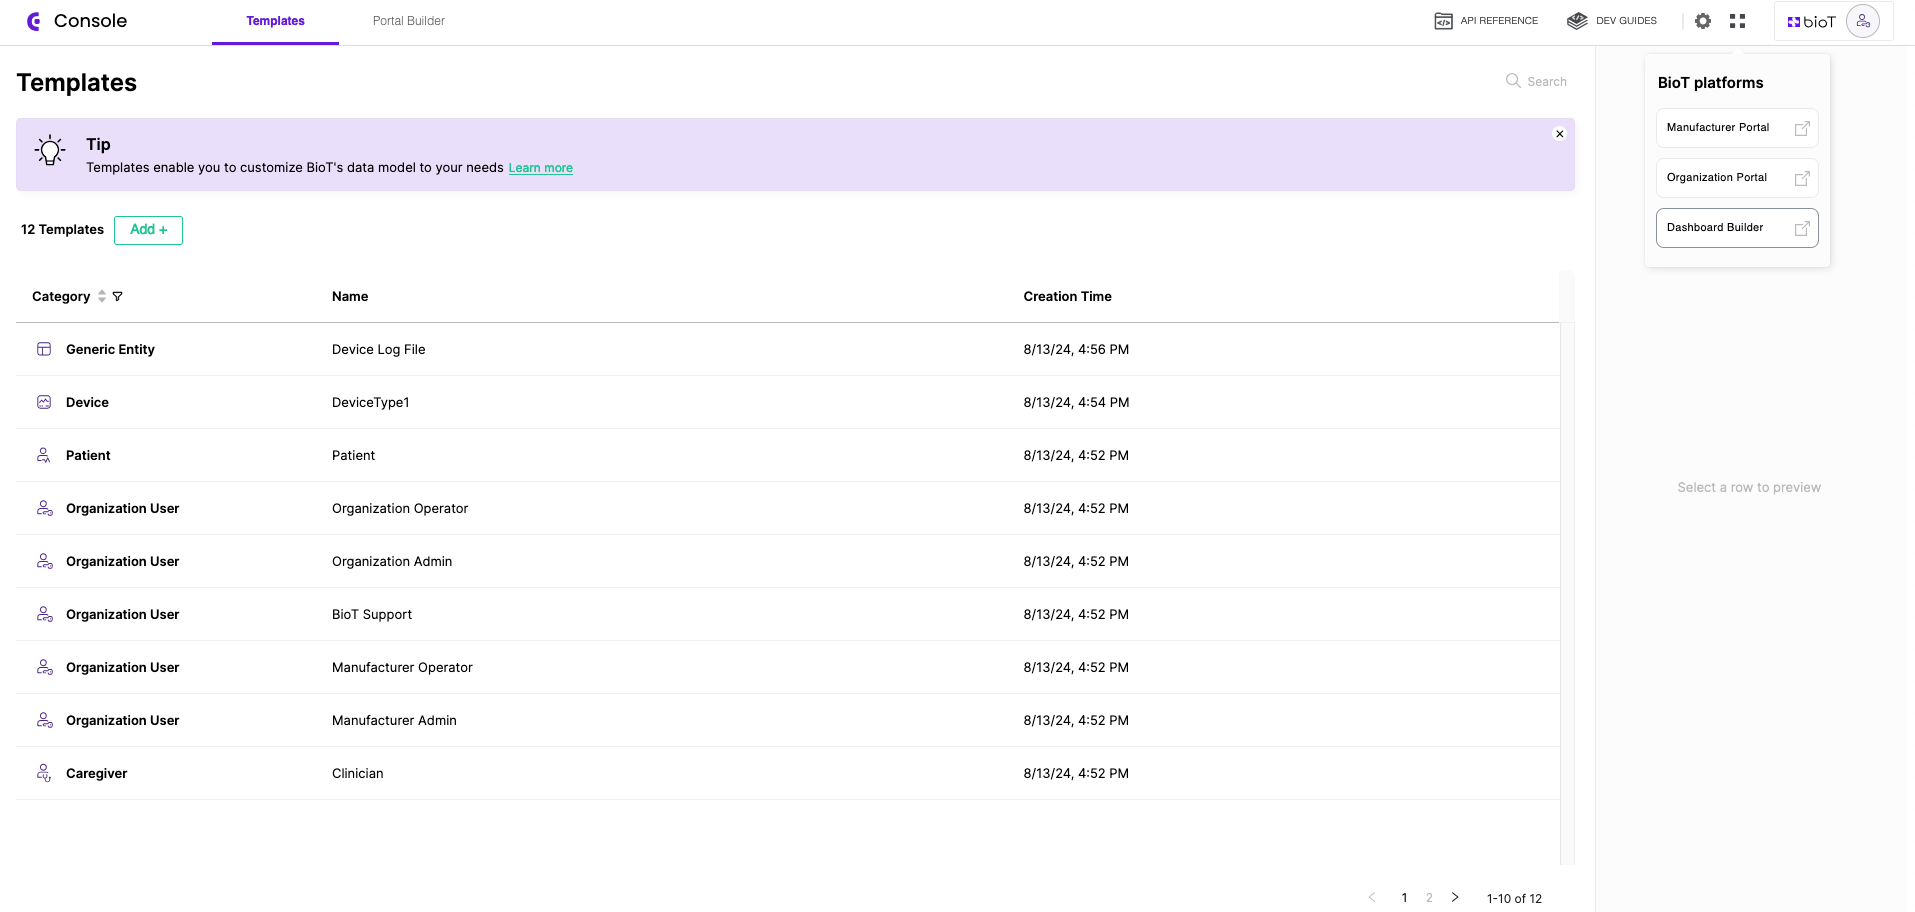
This will open your Grafana workspace.
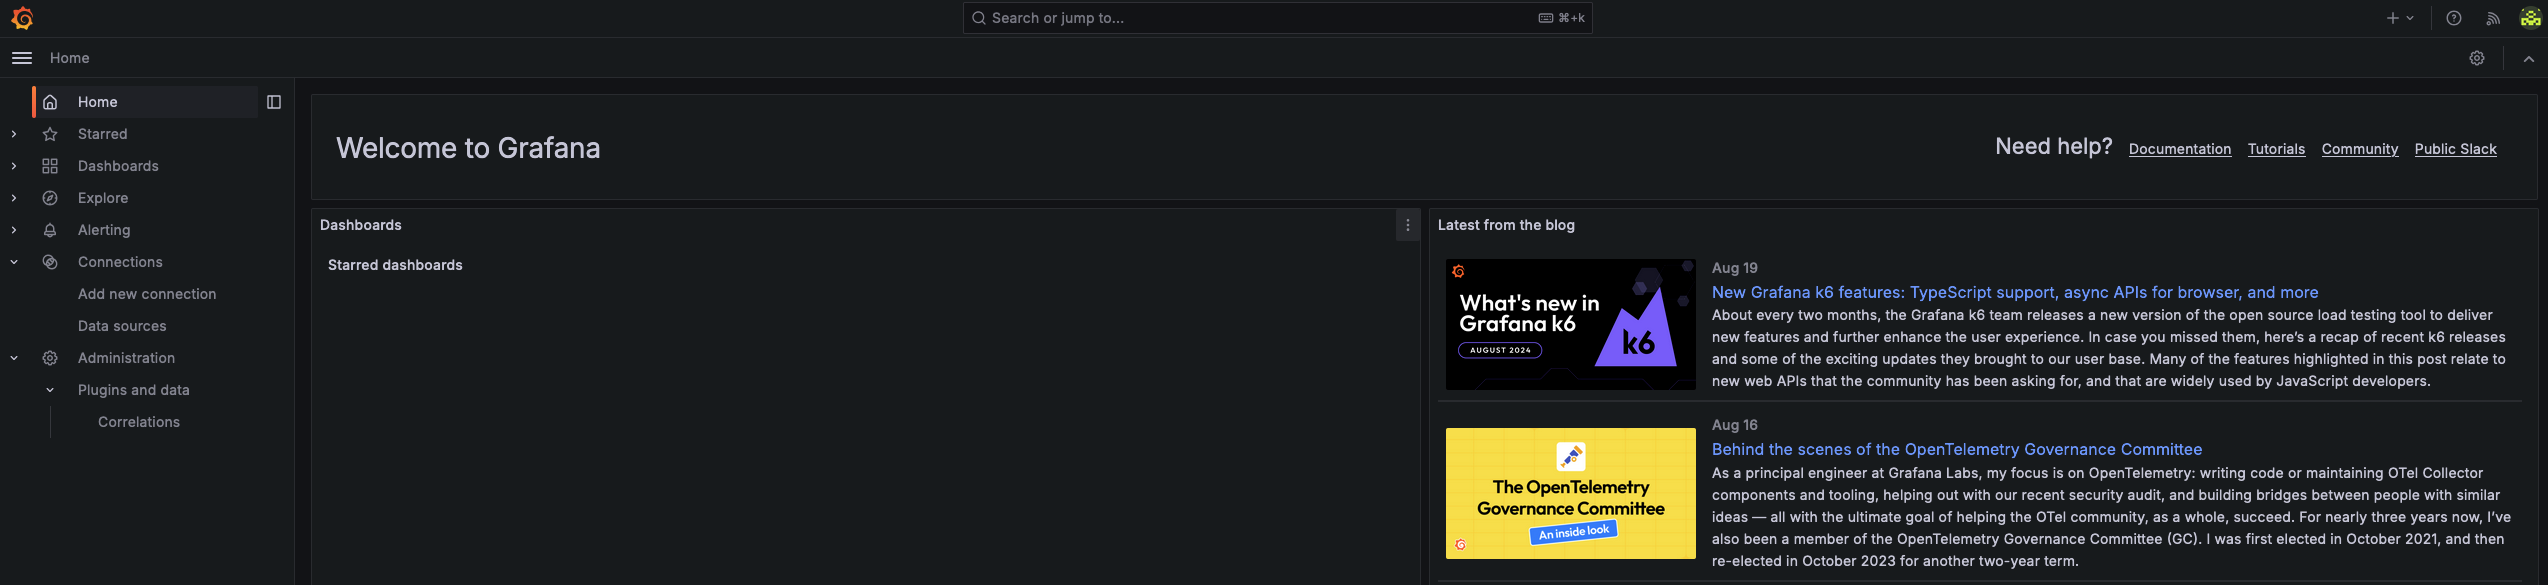
To create or edit dashboards, you also need Grafana administrator credentials. These are separate from your BioT user account- if you haven't received them, contact us.
Once you are logged in, you can begin building your dashboards.
Before you start:This guide covers BioT’s additional capabilities. For more information on building dashboards and maximizing Grafana’s features, please refer to Grafana's documentation.
BioT's DataSource Plugin
After successfully logging in, you can begin creating dashboards using BioT’s DataSource plugin. To view the plugin, navigate to the sidebar, select “Connections,” and then choose “Data Sources.”

From there, you can click “Build Dashboard” to start working with your data. Alternatively, you can create a new dashboard or access existing ones by selecting “Dashboard” from the sidebar menu.
Updated 24 days ago