Viewing Live Measurements
The Patient page has two tabs. The Overview tab contains the patient's details, and the Observations tab contains live readings from any devices that are assigned to the patient. To view live readings from a device, the device must be powered on and connected to the BioT platform.
NoteIt is possible to configure whether the Observations tab opens to the Live view or the Historical view. This can be configured in the Portal Builder (for more information, see Customizing Organization Portal Layouts).
To get to the Observations tab:
- Login to the BioT Organization Portal.
- Select a patient to view.
- From the Patient page, click on the Observations tab.

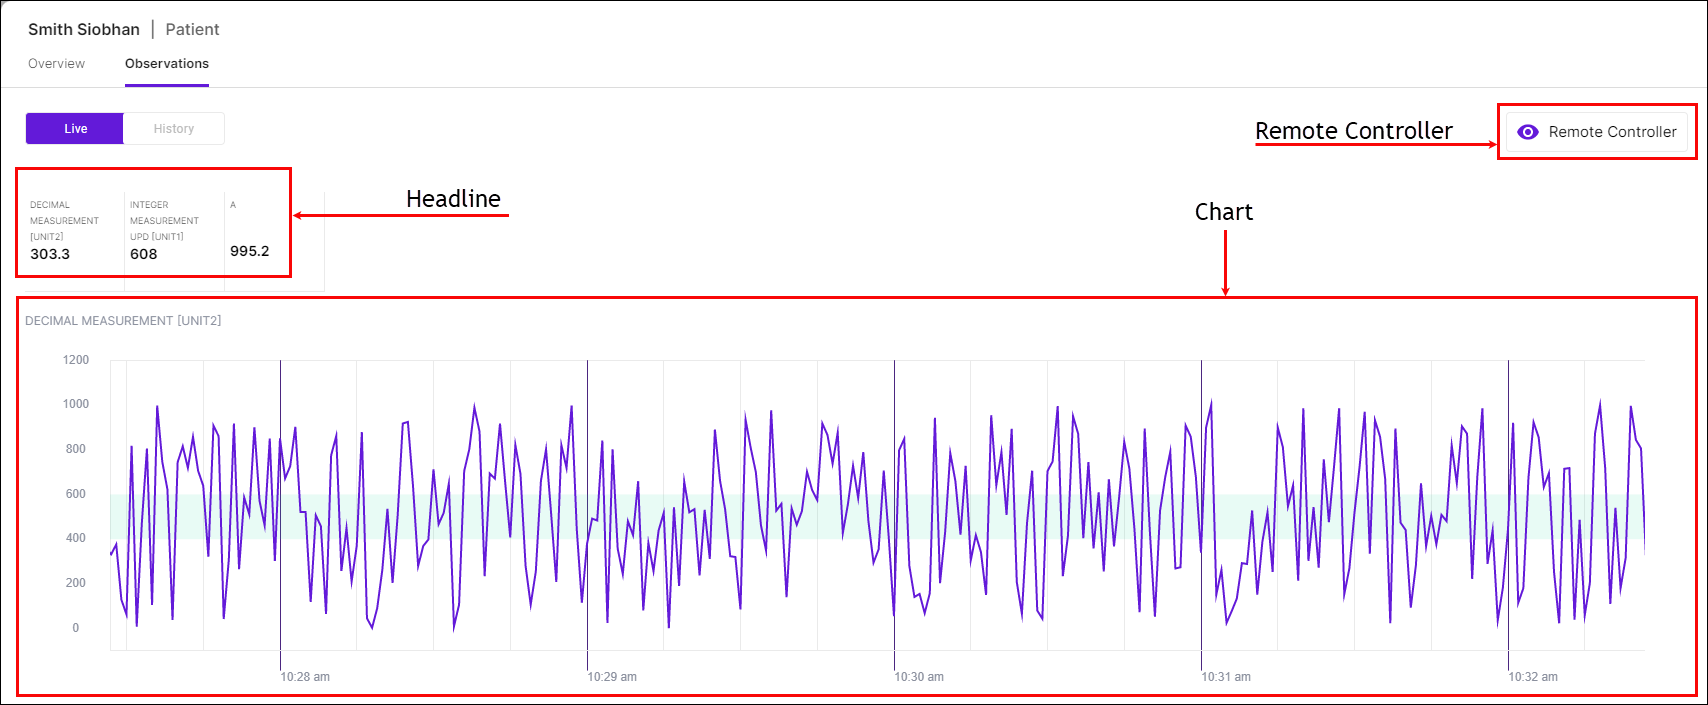
The Observations tab is comprised of the following areas:
- The Headline is at the top left.
- The Remote Controller is at the top right (see Remote Controlling a Device).
- The Charts take up the rest of the screen, one chart for each measurement.
Notes
- The charts shown in the image above are for the purposes of example only and do not reflect real-world charts for the measurements shown.
- The headlines and charts displayed can be configured in the Portal Builder and are the same for both live and historical measurements (see Customizing Organization Portal Layouts).
Headline
The Headline gives values of the current measurements. These are the most recent measurements taken for the patient. For example, the metrics might be: Heart rate (103 beats per minute), Respiratory rate (20 respirations per minute), and SpO2 (98% oxygen saturation in the bloodstream).
Charts
The charts let you see the patient's measurements over time. After opening the Observations tab, you can see the vitals for up to 5 minutes in the past.
The chart adjusts the vertical, units "y-axis" to reflect the minimum and maximum values of the actual measurements received and displayed. The horizontal, time "x-axis" moves left in real time.
A shaded horizontal bar appears on the charts, indicating the normal range of the measurement units. This makes it easy to see abnormal measurements.
If for some reason the measurements are not received for a period of time, a gap appears in the chart during the disruption. This can be happen if the device is not transmitting or if there is a network connection problem.

The BioT platform administrator can configure which metrics are shown, as well as what units are used and what the normal ranges are for each. This is done in the Observations tab of the Patient template in the BioT Console (see Editing the Patient Template).
The layout of the Observations tab also depends on the settings the administrator set in the Portal Builder.
Updated 6 months ago
