Managing the Patient Monitoring Station
The Patient Monitoring Station tab displays a list of all the patients monitored in the Organization Portal and their vital signs.
The Patient Monitoring Station, accessible from the Organization Portal, allows you to monitor all of your patients and view their statuses in real time.
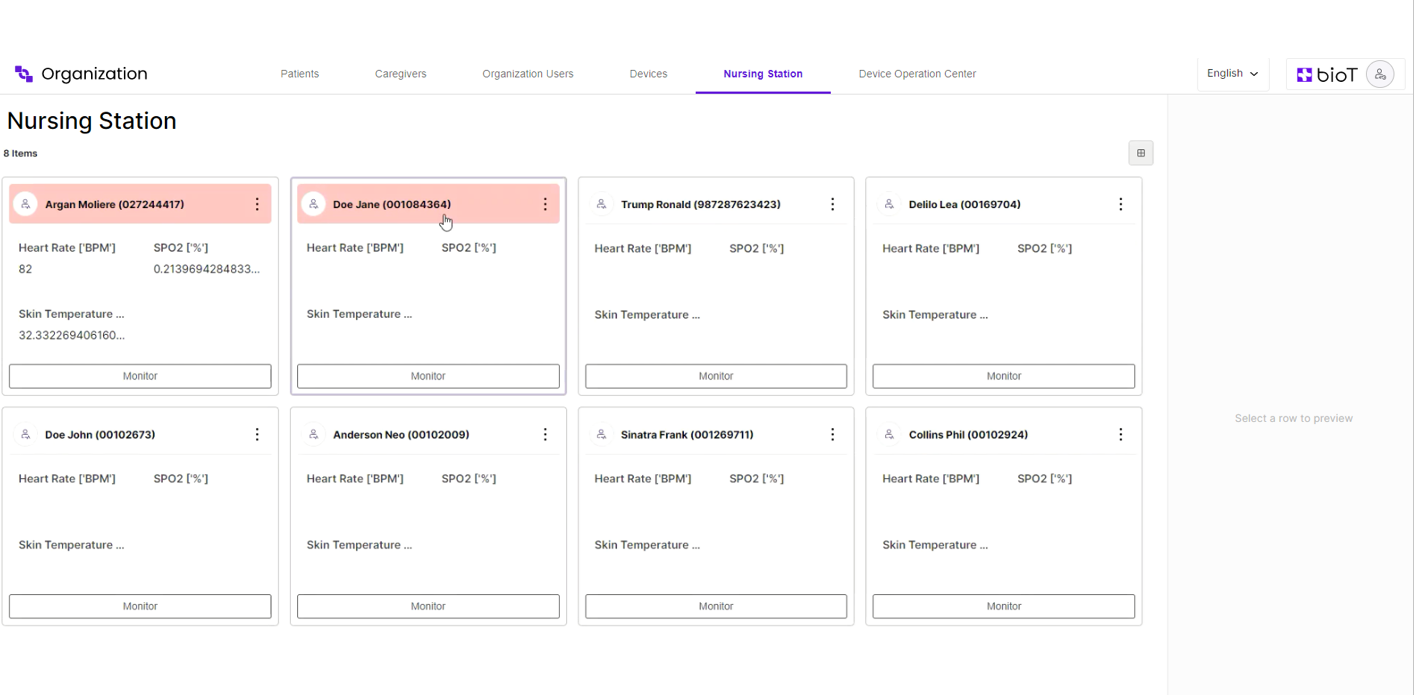
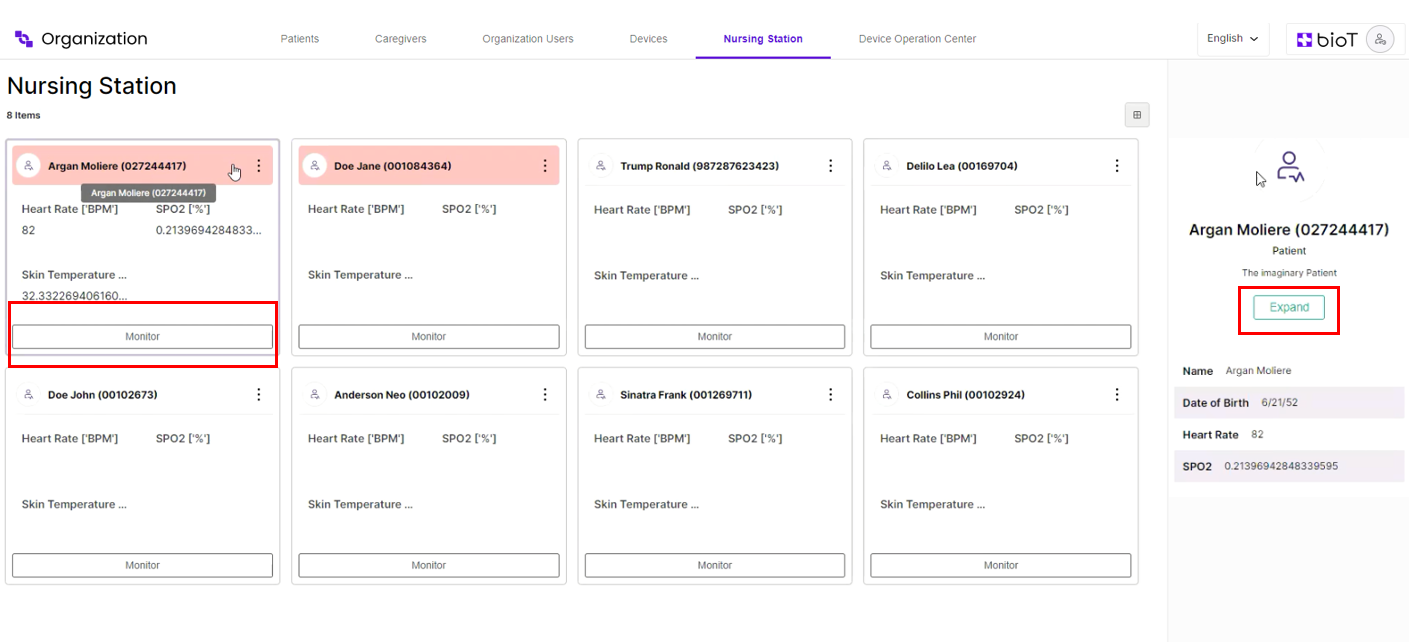
Selecting a patient box from the list displays the patient's basic info on the right. To view more detailed information or view the patient's live measurements, click Monitor from the patient box or Expand from the right section of the screen.
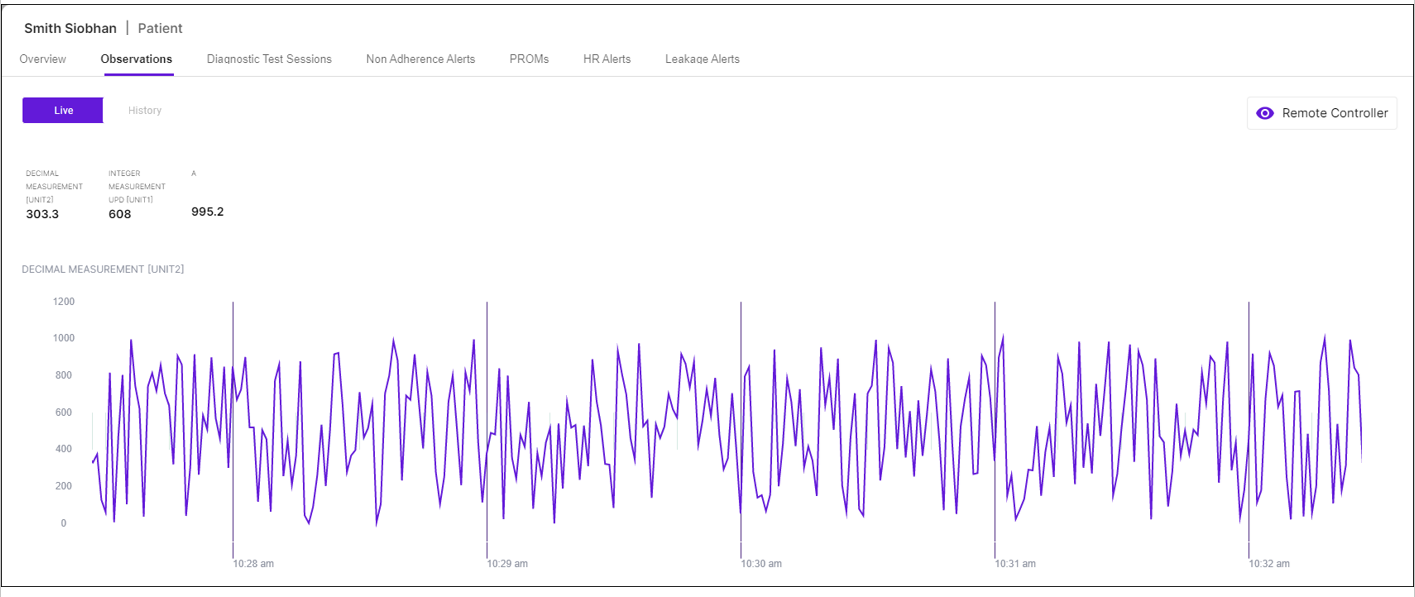
This directly opens the patient's Observations tab, which contains live readings from any devices that are assigned to the patient. See Viewing Live Measurements for a more detailed explantion.
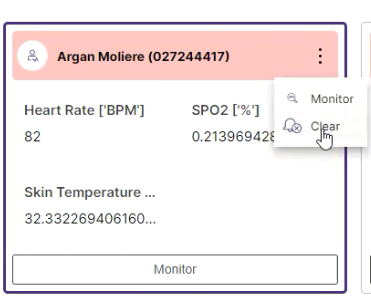
Note that some patient boxes might be marked in red. These are patients who have active alerts regarding their status. To remove this marking, select Clear from the ellipsis menu in the patient box.
NoteAlerts are generated via API requests, either by the device itself or by a plugin that is notified when a new measurement is recorded. For more information and examples, see Alerts Generation.
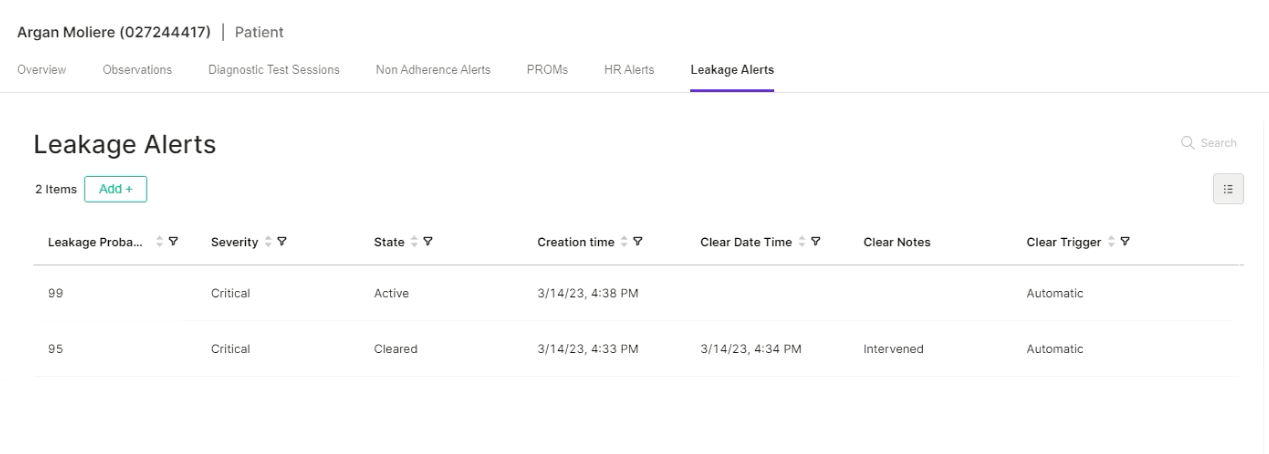
To view a detailed list of all patient alerts, click Monitor and go to the relevant alert tab. In the example below, the tabs are Non Adherence, HR, or Leakage Alerts. The alert list in each tab displays both active and cleared alerts.
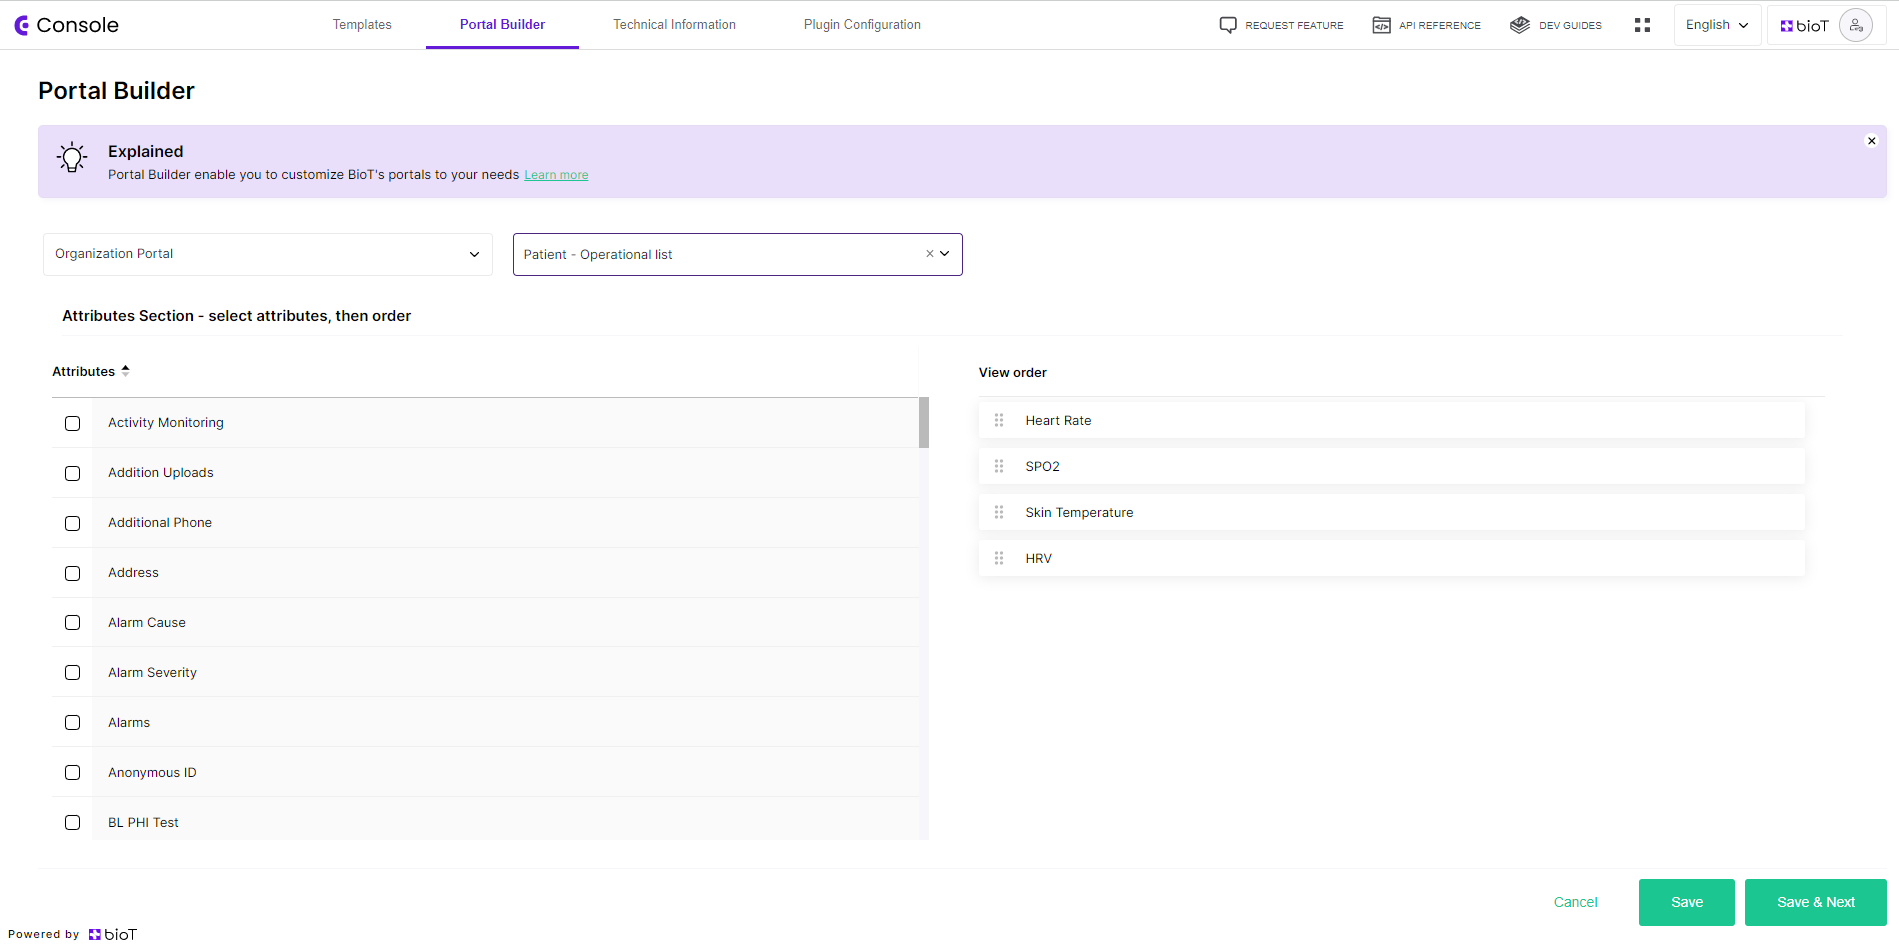
From the Portal Builder, you can define which vital signs to display for each patient in the Patient Monitoring Station:
- Select the Organization Portal.
- Select Patient - operational list.
- Select attributes and order them as required.
- Click Save.
You can also use the Portal Builder to select which attributes you want to see in the alert section, as demonstrated in the following image:

Updated 6 months ago
